正規分布
概要
平均を μ, 分散を σ2 > 0 とする(1次元)正規分布とは、確率密度関数が次の形(ガウス関数と呼ばれる)
で与えられる確率分布のことである[1][2]。この分布を N(μ, σ2) と表す[1]。(N は「正規分布」を表す英語 "normal distribution" の頭文字から取られている)。
標準正規分布
特に μ = 0, σ2 = 1 のとき、この分布は(1次元)標準正規分布(または基準正規分布)と呼ばれる[3]。つまり標準正規分布 N(0, 1) は
なる確率密度関数を持つ確率分布として与えられる。
再生性
正規分布は再生性を持つ[4] —— つまり確率変数 X1, …, Xn が独立にそれぞれ正規分布 N(μ1, σ12), …, N(μn, σn2) に従うとき、線型結合 ∑aiXi は正規分布 N(∑aiμi, ∑ai2σi2) に従う。
確率密度関数
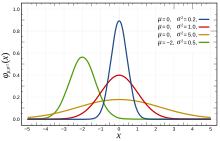
正規分布の確率密度関数をグラフ化した正規分布曲線は左右対称な釣鐘状の曲線であり、鐘の形に似ていることからベル・カーブ(鐘形曲線)とも呼ばれる。直線 x = μ に関して対称であり、x 軸は漸近線である。なお、曲線は σ の値が大きいほど扁平になる。
なお、中心極限定理により、巨大な n に対する二項分布とも考えることができる。
平均値の周辺の n 次中心化モーメントは、各次数 n に対して
となることが知られている[5]。(2n − 1)!! := (2n − 1) ⋅ (2n − 3) ⋅ … ⋅ 3 ⋅ 1。
多変量正規分布
また、多変量の統計として共分散まで込めた多次元の正規分布も定義され、平均 μ = (μ1, μ2, …, μn) の n 次元正規分布の同時密度関数は次の式で与えられる。
ここで、∑ = (σij) は分散共分散行列と呼ばれる正定値対称行列である。|Σ| は Σ の行列式。なお、A[x] は(対称)行列 A とベクトル x に対して二次形式 xTAx を意味するもの(ジーゲルの記号)とすると (x − μ)T∑−1(x − μ) = ∑−1[x − μ] と書くこともできる。
この n 次元正規分布を Nn(μ, ∑) と表す[6]。特に1次元の場合、平均 (μ) と分散共分散行列 ∑ = (σ2) は共に1次元の平均と分散を意味する1つの実数値であり、記号 N1((μ), ∑) = N1((μ), (σ2)) は単に N(μ, σ2) と書かれる(先に述べた1次元の場合の記号と同じものと理解してよい)。
歪正規分布
正規分布の拡張としては、上で示した多次元化を施した多変量正規分布の他に、歪正規分布 (Skew-Normal (SN) distribution) がある。これは三変数で表現され、そのうち1つの変数について α = 0 のときに正規分布となることから、分布を平均と分散の二変数で表現する正規分布の拡張であるといえる。φ(x) を標準正規分布の確率密度関数とする。
その累積確率密度関数は次で与えられる。
ここに "erf" は誤差関数(シグモイド関数)である。このとき、標準正規分布に対応する歪正規分布 SN(0, 1, α) の確率密度関数は次で与えられる。
これに平均のようなもの相当する変数と分散のようなものに相当する変数を加えるためにZ変換(標準化)の逆 y = ξ + ωx を施す。すると歪正規分布は一般の形になり、以下の関係が成り立つ。
歴史
正規分布はアブラーム・ド・モアブルによって1733年に導入された[7]。この論文はド・モアブル自身による1738年出版の The Doctrine of Chances 第二版の中で、高い次数に関する二項分布の近似の文脈において再掲されている。ド・モアブルの結果はピエール=シモン・ラプラスによる『確率論の解析理論』(1812年)において拡張され、いまではド・モアブル–ラプラスの定理と呼ばれている。
ラプラスは正規分布を実験の誤差の解析に用いた。その後アドリアン=マリ・ルジャンドルによって1805年に最小二乗法が導入され[8]、1809年のカール・フリードリヒ・ガウスによる誤差論で詳細に論じられた(ガウスは1794年から最小二乗法を知っていたと主張していた)。
「ベル・カーブ」という名前は、1872年に2変数正規分布に対して「鐘形曲面」という言葉を用いた Esprit Jouffret(英語版) にさかのぼる。「正規分布」という言葉はチャールズ・サンダース・パース、フランシス・ゴルトン、ヴィルヘルム・レキシスの3人によって1875年頃に独立に導入された。
統計的な意味
正規分布 N(μ, σ2) からの無作為標本 x を取ると、平均 μ からのずれが ±1σ 以下の範囲に x が含まれる確率は 68.27%、±2σ 以下だと 95.45%、さらに ±3σ だと 99.73% となる。
正規分布は、t分布やF分布といった種々の分布の考え方の基礎になっているだけでなく、実際の統計的推測においても、仮説検定、区間推定など、様々な場面で利用される。
正規分布 N(μ, σ) に従う確率変数 X が与えられたとき Z = X − μ/σ と標準化すれば確率変数 Z は標準正規分布に従う。大学レベルの統計入門のクラスでは必ず行われているが、Z 値を求めることでと呼ばれる変量に対応した確率を表す一覧表を用いて、コンピュータを使うことなく正規分布に従った事象の確率を求めることができる。
不連続値をとる確率変数についての検定の場合でも、連続変数と同様の考え方で正規分布を近似的に用いることがある。これは標本の大きさ n が大きく、かつデータの階級幅が狭いほど、近似の精度が高い。
| 信頼区間 | 信頼度 | 危険率 | |
|---|---|---|---|
| 百分率 | 百分率 | 比 | |
| 0.318 639σ | 25% | 75% | 3/4 |
| 0.674490σ | 50% | 50% | 1/2 |
| 0.994458σ | 68% | 32% | 1/3.125 |
| 1σ | 68.2689492% | 31.7310508% | 1/3.1514872 |
| 1.281552σ | 80% | 20% | 1/5 |
| 1.644854σ | 90% | 10% | 1/10 |
| 1.959964σ | 95% | 5% | 1/20 |
| 2σ | 95.4499736% | 4.5500264% | 1/21.977895 |
| 2.575829σ | 99% | 1% | 1/100 |
| 3σ | 99.7300204% | 0.2699796% | 1/370.398 |
| 3.290527σ | 99.9% | 0.1% | 1/1000 |
| 3.890592σ | 99.99% | 0.01% | 1/10000 |
| 4σ | 99.993666% | 0.006334% | 1/15787 |
| 4.417173σ | 99.999% | 0.001% | 1/10,0000 |
| 4.5σ | 99.9993204653751% | 0.0006795346249% | 1/14,7159.5358 |
| 4.891638σ | 99.9999% | 0.0001% | 1/100,0000 |
| 5σ | 99.9999426697% | 0.0000573303% | 1/174,4278 |
| 5.326724σ | 99.99999% | 0.00001% | 1/1000,0000 |
| 5.730729σ | 99.999999% | 0.000001% | 1/1,0000,0000 |
| 6σ | 99.9999998027% | 0.0000001973% | 1/5,0679,7346 |
| 6.109410σ | 99.9999999% | 0.0000001% | 1/10,0000,0000 |
| 6.466951σ | 99.99999999% | 0.00000001% | 1/100,0000,0000 |
| 6.806502σ | 99.999999999% | 0.000000001% | 1/1000,0000,0000 |
| 7σ | 99.9999999997440% | 0.000000000256% | 1/3906,8221,5445 |
正規分布の適用
自然界の事象の中には正規分布に従う数量の分布をとるものがあることが知られている[9]。また、そのままでは変数が正規分布に従わない場合もその対数をとると正規分布に従う場合がある。
正規分布が統計学上特別な地位を持つのは中心極限定理が存在するためである。中心極限定理は、「独立な同一の分布に従う確率変数の算術平均(確率変数の合計を変数の数で割ったもの)の分布は、元の確率変数に標準偏差が存在するならば、元の分布の形状に関係なく、変数の数が多数になったとき、正規分布に収束する」というものである。このため大標本の平均値の統計には、正規分布が仮定されることが非常に多い。
前述のごとく自然界の事象の中には、正規分布に従う数量の分布をとるものがあることが知られている。しかしそれは必ずしも多数派というわけではない。19世紀ではさながら「正規分布万能主義」といったものがまかり通っていたが、20世紀以降そういった考え方に修正が見られた。今日においては社会現象、生物集団の現象等々、種別から言えば、正規分布に従うものはむしろ少数派であることが確認されている。例えば、フラクタルな性質を持つ物は正規分布よりも、パレート分布になることが多い。人間は自然界の事象とは違って自分の意思をもっているため、たとえば、子供の成績などは決して正規分布にはならない[9]。しかし、そもそも理論上、正規分布の x の値は負の無限大から正の無限大まで取れるのに対して、多くの事象は最小値(例えば比例尺度におけるゼロ)と最大値(例えばテストにおける100点満点)が予め定まっている場合があり、そのような事象が完全な正規分布に従うとするには無理がある(その際はcensoringつまり打ち切りを考慮したり、対数正規分布を用いたりするとより正確な確率を求めることが出来る場合がある)。また、0 および自然数しかとらない離散確率分布、例えばポアソン分布や二項分布を連続確率分布である正規分布で近似することも一般的に行われている。
検定
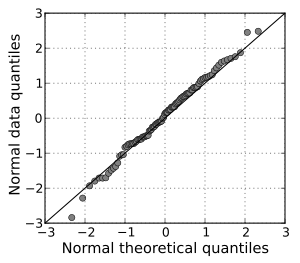
何らかの事象について法則性を捜したり理論を構築しようとしたりする際、その確率分布がまだ分かっていない場合にはそれが正規分布であると仮定して推論することは珍しくないが、誤った結論にたどりついてしまう可能性がある。標本データが正規分布に近似しているかどうを判断するためには、尖度と歪度を調べる、ヒストグラムを見る、正規Q-Qプロットをチェックする、あるいはシャピロ–ウィルク検定やコルモゴロフ–スミルノフ検定(正規分布)を利用する方法などが一般的に行われている。
点推定
平均や分散が未知の正規分布に従うデータから、母数 θ = (μ, σ2) を推定したいことがある。これには次の推定量 がよく用いられる。正規分布 N(μ, σ2) からの無作為標本 x1, …, xn が与えられたとき、
区間推定
| 詳細 この節の加筆が望まれています。 |
脚注
- ^ a b 稲垣 1990, pp. 44–45.
- JIS Z 8101-1 : 1999, 1.25 正規分布.
- JIS Z 8101-1 : 1999, 1.26 標準正規分布 (standardized normal distribution, standardized Laplace–Gauss distribution).
- Cramér 1946, § 17.3.
- Cramér 1946, (17.2.3).
- 稲垣 1990, p. 86.
- Abraham de Moivre, "Approximatio ad Summam Terminorum Binomii (a + b)n in Seriem expansi"(1733年11月12日に私的な回覧用にロンドンで印刷された。)このパンフレットは以下に挙げる各書物に再掲されている: (1) Richard C. Archibald (1926) "A rare pamphlet of Moivre and some of his discoveries," Isis, vol. 8, pages 671–683; (2) Helen M. Walker, "De Moivre on the law of normal probability" in David Eugene Smith, A Source Book in Mathematics [New York, New York: McGraw-Hill, 1929; reprinted: New York, New York: Dover, 1959], vol. 2, pages 566–575.; (3) Abraham De Moivre, The Doctrine of Chances (2nd ed.) [London: H. Woodfall, 1738; reprinted: London: Cass, 1967], pages 235-243; (3rd ed.) [London: A Millar, 1756; reprinted: New York, New York: Chelsea, 1967], pages 243–254; (4) Florence N. David, Games, Gods and Gambling: A History of Probability and Statistical Ideas [London: Griffin, 1962], Appendix 5, pages 254–267.
- Stigler 1986, Figure 1.5.
- ^ a b 遠山啓『数学入門(下)』岩波書店〈岩波新書〉(原著1960年10月20日)、初版、87頁。2009年3月5日閲覧。
- 岩波数学辞典 2007, 付録 公式 23.
参考文献
| 詳細 |
- ハラルド・クラメール (1946). Mathematical Methods of Statistics. Princeton Mathematical Series. 9. Princeton University Press. MR0016588. Zbl 0063.01014. https://books.google.com/books?id=CRTKKaJO0DYC (Review by W. Feller)
- 稲垣宣生『数理統計学』裳華房、1990年。ISBN 4-7853-1406-0。
- JIS Z 8101-1:1999 統計 − 用語と記号 − 第1部:確率及び一般統計用語, 日本規格協会, http://kikakurui.com/z8/Z8101-1-1999-01.html
- Stigler, Stephen M. (1986). The History of Statistics: The Measurement of Uncertainty before 1900. The Belknap Press of Harvard University Press. ISBN 0-674-40340-1. MR0852410. Zbl 0656.62005. https://books.google.com/books?id=M7yvkERHIIMC
- 『岩波 数学辞典』日本数学会、岩波書店、2007年、第4版。ISBN 978-4-00-080309-0。
関連項目
外部リンク
- 正規分布表 (PDF) —— 脇本和昌『身近なデータによる統計解析入門』森北出版、1973年。ISBN 4627090307。 付表
- 『正規分布』 - コトバンク
Normal distribution - Wikipedia
Normal distribution
In probability theory, a normal (or Gaussian or Gauss or Laplace–Gauss) distribution is a type of continuous probability distribution for a real-valued random variable. The general form of its probability density function is
Probability density function  The red curve is the standard normal distribution | |||
Cumulative distribution function  | |||
| Notation | |||
|---|---|---|---|
| Parameters | = mean (location) = variance (squared scale) | ||
| Support | |||
| CDF | |||
| Quantile | |||
| Mean | |||
| Median | |||
| Mode | |||
| Variance | |||
| MAD | |||
| Skewness | |||
| Ex. kurtosis | |||
| Entropy | |||
| MGF | |||
| CF | |||
| Fisher information | |||
| Kullback-Leibler divergence | |||
The parameter is the mean or expectation of the distribution (and also its median and mode), while the parameter is its standard deviation. The variance of the distribution is .[1] A random variable with a Gaussian distribution is said to be normally distributed, and is called a normal deviate.
Normal distributions are important in statistics and are often used in the natural and social sciences to represent real-valued random variables whose distributions are not known.[2][3] Their importance is partly due to the central limit theorem. It states that, under some conditions, the average of many samples (observations) of a random variable with finite mean and variance is itself a random variable—whose distribution converges to a normal distribution as the number of samples increases. Therefore, physical quantities that are expected to be the sum of many independent processes, such as measurement errors, often have distributions that are nearly normal.[4]
Moreover, Gaussian distributions have some unique properties that are valuable in analytic studies. For instance, any linear combination of a fixed collection of normal deviates is a normal deviate. Many results and methods, such as propagation of uncertainty and least squares parameter fitting, can be derived analytically in explicit form when the relevant variables are normally distributed.
A normal distribution is sometimes informally called a bell curve.[5] However, many other distributions are bell-shaped (such as the Cauchy, Student's t, and logistic distributions).
Definitions
Standard normal distribution
The simplest case of a normal distribution is known as the standard normal distribution or unit normal distribution. This is a special case when 

Here, the factor 


Authors differ on which normal distribution should be called the "standard" one. Carl Friedrich Gauss, for example, defined the standard normal as having a variance of 
On the other hand, Stephen Stigler[6] defines the standard normal as having a variance of 
General normal distribution
Every normal distribution is a version of the standard normal distribution, whose domain has been stretched by a factor 

The probability density must be scaled by 
If 


![{\displaystyle {\frac {1}{2}}\left[1+\operatorname {erf} \left({\frac {x-\mu }{\sigma {\sqrt {2}}}}\right)\right]}](https://wikimedia.org/api/rest_v1/media/math/render/svg/187f33664b79492eedf4406c66d67f9fe5f524ea)


0 件のコメント:
コメントを投稿